Monitoring guide for SPs
The ARGO Monitoring service provides a flexible and scalable framework for monitoring status, availability and reliability of a wide range of services provided by infrastructures with medium to high complexity. ARGO generates reports using customer defined profiles (e.g. for SLA management, operations, etc.). During the report generation, ARGO takes into account custom factors such as the importance of a specific service endpoint and scheduled or unscheduled downtimes.
ARGO Monitoring Service for NI4OS consists of production and development infrastructure. Production infrastructure is deployed in a redundant manner and is used for generating reports and raising alarms for production-grade on-boarded services. Development infrastructure is used for testing and integration of new services and probes. Web UI can be found:
- Production: https://argo.ni4os.eu
- Development: https://argo-devel.ni4os.eu
Topology
Monitoring service relies on topology database to provide the following information:
- the monitored service(s)
- the service types they are running (ex. wiki)
- the service endpoints of the service (ex. endpoint)
- the way they are organized (ex. in groups of sites, in groups of services)
- the service actors (owners, admins, contact points).
When adding service endpoint following fields are mandatory for monitoring service:
- Production Level (Is this service in production?):
- Y = monitored on production & development infrastructure
- N = monitored only on development infrastructure
- Monitored (Is this service monitored?)
- must be set to Y
- Notifications (Do you wish to receive notifications about this service?)
- set to Y if you wish to receive alerts.
For example: Service URL: https://www.mywebapp.com:9999
| row 2 cell 1 | row 2 cell 2 | |
| Yes | No | |
|---|---|---|
| Production Level (Is this service in production?): | Monitored (Is this service monitored?) | Notifications (Do you wish to receive notifications about this service?) |
Extra GOCDB attributes
ARGO can use extra GOCDB attributes to properly monitor service endpoints. Table below will contain attributes that must be defined for each service type. Until now there are no extra GOCDB attributes.
Metrics
A metric is a simple chunk of code that checks specific functionality of a given service. For example: Portal-WebCheck: checks the http if it responds CertValidity: checks the validity of a certificate
For your service you will need some metrics so as to start monitoring it. We will start monitoring with some basic checks like webcheck and cert validity.
Service probe
Apart from the basic checks each service should have a list of specific metrics from the user perspective. Monitoring services from the user point of view means that all the services have to be monitored in the same way regardless of who the service providers are and where they are located.
The owners of the service are the ones that know exactly how the service is working. The service development team with the support of the monitoring team is responsible to implement the probe that checks and at the same time mimics the actual end user behaviour without requiring special privileges or special configurations.
Before you start implementing your own probe we would like to inform you that ARGO Monitoring has a list of probes that are used for the services already monitored. So the SP should search in the library if he want(s) to use them:
- Probes: https://poem.ni4os.eu/ui/public_probes
- Metrics (currently available): https://poem.ni4os.eu/ui/public_metrics
- Nagios Exchange: https://exchange.nagios.org/
If you cannot find a probe for your service then you should follow the development process described in the next chapter.
Probe Development Process
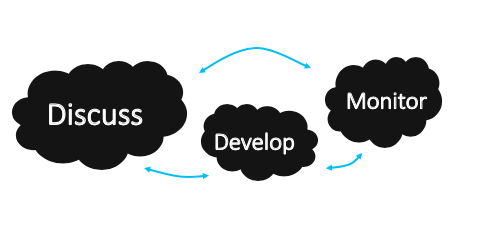
- Discuss (what to check): Discussion with representatives - developers of each service in order to agree on a set of monitored metrics.
- Develop (How to check): Development and testing of probe(s). The development lifecycle includes: coding of the probe, documentation, testing and packaging.
- Monitor (Lets start monitoring): The lifecycle of the deployment of the service probe is based on the following repetitive steps: a) guidelines from the service owners are created. The monitoring team makes the necessary configurations. b) test, verify. if it passes the tests c) The report changes and now has your service metrics!!!! Monitoring starts and you can get the status A/R reports for your service.
The probe development guidelines: http://argoeu.github.io/monitoring-probes/v1/guidelines_for_monitoring_probes/
Checklist
References
